36. CAPITAL BUDGETING
A. Capital budgeting process, typical steps and various categories of capital projects :
The capital budgeting process is the process of identifying and evaluating capital projects, that is, projects where the cash flow to the firm will be received over a period longer than a year.
The capital budgeting process has four administrative steps :
- Idea generation.
- Analyzing project proposals. Cash flow forecast must be made to determine its expected profitability.
- Create the firm-wide capital budget. Firms must prioritize profitable projects.
- Monitoring decisions and conducting post-audit. An analyst should compare actual results to the projected results. A post audit should be used to identify systematic errors in the forecasting process and improve company operations.
Capital budgeting projects may be divided into the following categories :
- Replacement projects to maintain the business.
- Replacement projects for cost reduction.
- Expansion projects.
- New product or market development.
- Mandatory projects. Typically generate little to no revenue, but they accompany new revenue-producing projects undertaken by the company.
- Other projects.
B. Basic principles of capital budgeting :
The capital budgeting process involves five key principles :
1. Decisions are based on cash flows, not accounting income.
The relevant cash flows to consider as part of the capital budgeting process are incremental cash flows, the changes in cash flows that will occur if the project is undertaken.
Sunk costs are costs that cannot be avoided, even if the project is not undertaken. Because these costs are not affected by the accept/reject decision, they should not be included in the analysis.
Externalities are effects the acceptance of a project may have on other firm cash flows and should be taken into account. The primary one is a negative externality called cannibalization, which occurs when a new project takes sales from an existing product. A positive externality exists when doing the project would have a positive effect on sales of a firm’s product lines.
A project has a conventional cash flow pattern, if the sign on the cash flows changes only once, with one or more cash outflows followed by one or more cash inflows. An unconventional cash flow pattern has more than one sign change.
2. Cash flows are based on opportunity costs.
Opportunity costs are cash flows that a firm will lose by undertaking the project under analysis. Opportunity costs should be included in project costs. For example, when building a plant, even if the firm already owns the land, the cost of the land should be charged to the project because it could be sold if not used.
3. The timing of cash flows is important.
Capital budgeting decisions account for the time value of money, which means that cash flows received earlier are worth more than cash flows to be received later.
4. Cash flows are analyzed on an after-tax basis.
The impact of taxes must be considered when analyzing all capital budgeting projects. Firm value is based on cash flows they get to keep, not those they send to the government.
5. Financing costs are reflected in the project’s required rate of return.
Do not consider financing costs specific to the project when estimating incremental cash flows. The discount rate used in the capital budgeting analysis takes account of the firm’s cost of capital. Only projects that are expected to return more than the cost of the capital needed to fund them will increase the value of the firm.
C. Mutually exclusive projects, project sequencing and capital rationing :
Independent vs. mutually exclusive projects :
Independent projects are projects that are unrelated to each other and allow for each project to be evaluated based on its own profitability. For example, if project A and project B are independent, and both projects are profitable, then the firm could accept both projects.
Mutually exclusive means that only one project in a set of possible projects can be accepted and that the projects compete with each other. A capital budgeting decision between two different stamping machines with different costs and output would be an example of choosing between two mutually exclusive projects.
Project sequencing :
Some projects must be undertaken in a certain order, or sequence, so that investing in a project today creates the opportunity to invest in other projects in the future. For example, if a project undertaken today is profitable, that may create the opportunity to invest in a second project a year from now. However, if the project undertaken today turns out to be unprofitable, the firm will not invest in the second project.
Unlimited funds vs. capital rationing :
If a firm has unlimited access to capital, the firm can undertake all projects with expected returns that exceed the cost of capital. Many firms have constraints on the amount of capital they can raise and must use capital rationing. If a firm’s profitable project opportunities exceed the amount of funds available, the firm must ration, or prioritize, its capital expenditures with the goal of achieving the maximum increase in value for shareholders given its available capital.
D. Net Present Value (NPV), Internal Rate of Return (IRR), payback period, discounted payback period, and Profitability Index (PI) :
Net Present Value (NPV) :
The net present value (NPV) is the sum of the present values of all the expected incremental cash flows if a project is undertaken. The discount rate used is the firm’s cost of capital, adjusted for the risk level of the project. For a normal project, with an initial outflow followed by a series of expected after-tax cash inflows, the NPV is the present value of the expected inflows minus the initial cost of the project.
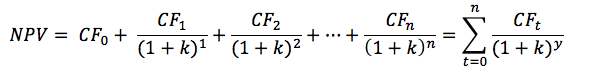
where :
CF0 = initial investment outlay (a negative cash flow)
CFt = after-tax cash flow at time t
k = required rate of return for project
A positive NPV project is expected to increase shareholder wealth, a negative NPV project is expected to decrease shareholder wealth, and a zero NPV project has no expected effect on shareholder wealth.
For independent projects, the NPV decision rule is simply to accept any project with a positive NPV and to reject any project with a negative NPV.
Internal Rate or Return (IRR) :
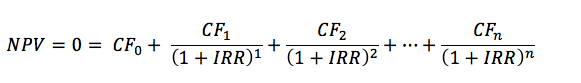
For a normal project, the internal rate of return (IRR) is the discount rate that makes the present value of the expected incremental after-tax cash inflows just equal to the initial cost of the project. More generally, the IRR is the discount rate that makes the present values of a project’s estimated cash inflows equal to the present value of the project’s estimated cash outflows. That is, IRR is the discount rate that makes the following relationship hold :
PV (inflows) = PV (outflows)
The IRR is also the discount rate for which the NPV of a project is equal to zero :
CF0 = initial investment outlay (a negative cash flow)
CFt = after-tax cash flow at time t
k = required rate of return for project
A positive NPV project is expected to increase shareholder wealth, a negative NPV project is expected to decrease shareholder wealth, and a zero NPV project has no expected effect on shareholder wealth.
For independent projects, the NPV decision rule is simply to accept any project with a positive NPV and to reject any project with a negative NPV.
Internal Rate or Return (IRR) :
For a normal project, the internal rate of return (IRR) is the discount rate that makes the present value of the expected incremental after-tax cash inflows just equal to the initial cost of the project. More generally, the IRR is the discount rate that makes the present values of a project’s estimated cash inflows equal to the present value of the project’s estimated cash outflows. That is, IRR is the discount rate that makes the following relationship hold :
PV (inflows) = PV (outflows)
The IRR is also the discount rate for which the NPV of a project is equal to zero :
IRR decision rule : First, determine the required rate of return for a given project. This is usually the firm’s cost of capital. Note that the required rate of return may be higher or lower than the firm’s cost of capital to adjust for differences between project risk and the firm’s average project risk.
If IRR > the required rate of return, accept the project.
If IRR < the required rate of return, reject the project.
Payback period :
The payback period (BPB) is the number of years it takes to recover the initial cost of an investment.
Because the payback period is a measure of liquidity, for a firm with liquidity concerns, the shorter a project’s payback period, the better. However, project decisions should not be made on the basis of their payback periods because of the method’s drawbacks.
The main drawbacks of the payback period are that it does not take into account either the time value of money or cash flows beyond the payback period, which means terminal or salvage value wouldn’t be considered. These drawbacks mean that the payback period is useless as a measure of profitability.
The main benefit of the payback period is that it is a good measure of project liquidity. Firms with limited access to additional liquidity often impose a maximum payback period and then use a measure of profitability, such as NPV or IRR, to evaluate projects that satisfy this maximum payback period constraint.
Discounted payback period :
The discounted payback period uses the present values of the project’s estimated cash flows. It is the number of years it takes a project to recover its initial investment in present value terms and, therefore, must be greater than the payback period without discounting.
The discounted payback period addresses one of the drawbacks of the payback period by discounting cash flows at the project’s required rate of return. However, the discounted payback period still does not consider any cash flows beyond the payback period, which means that it is a poor measure of profitability. Again, its use is primarily as a measure of liquidity.
Profitability Index (PI) :
The profitability index (PI) is the present value of a project’s future cash flows divided by the initial cash outlay :
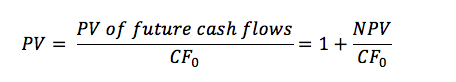
The profitability index is related closely to net present value. The NPV is the difference between the present value of future cash flows and the initial cash outlay, and the PI is the ratio of the present value of future cash flows to the initial cash outlay.
If the NPV of a project is positive, the PI will be greater than one. If the NPV is negative, the PI will be less than one. It follows that the decision rule :
If PI > 1, accept the project.
If PI <1, reject the project.
E. NPV profile, comparing NPV and IRR methods when evaluating independent and mutually exclusive projects :
A project’s NPV profile is a graph that shows a project’s NPV for different discount rates, NPV = f(discount rate). The NPV of a project diminishes when the discount rate increases, which creates a decreasing curve. The project’s IRR are the discount rates where the NPV profiles intersect the x-axis, because these are the discount rates for which the NPV equals zero.
When two NPV profiles intersect, the discount rate for which NPVs are equal is called the crossover rate.
Relative advantages and disadvantages of the NPV and IRR methods :
A key advantage of NPV is that it is a direct measure of the expected increase in the value of the firm. NPV is theoretically the best method. Its main weakness is that it does not include any consideration of the size of the project.
A key advantage if IRR is that it measures profitability as a percentage, showing the return on each dollar invested. The IRR provides information on the margin of safety that the NPV odes not. From the IRR, we can tell how much below the IRR the actual project return could fall, in percentage terms, before the project becomes uneconomic (negative NPV). The disadvantages of the IRR method are the possibility of producing rankings of mutually exclusive projects different from those from NPV analysis and the possibility that a project has multiple IRRs or no IRR.
Conflicting project rankings :
Let’s consider two projects, X and Y. Project X has a higher NPV, but lower IRR than project Y. Which is the better project? Because NPV measures the expected increase in wealth from undertaking a project, NPV is the only acceptable criterion when ranking projects.
If we were to rank projects by their IRRs, we would be implicitly assuming that project cash flows could be reinvested at the project’s IRR. This is unrealistic and, strictly speaking, if the firm could earn that rate on invested funds, that rate should be the one used to discount project cash flows.
Two reasons that NPV and IRR may give conflicting project rankings are the cash flow timing and the project size.
The “Multiple IRR” and “No IRR” problems :
If a project has cash outflows during its life or at the end of its life in addition to is initial cash outflow, the project is said to have an unconventional cash flow pattern. Projects with such cash flows may have mire than one IRR.
It is also possible to have a project where there is no discount rate that results in a zero NPV, that is, the project does not have an IRR. A project with no IRR may actually be profitable.
Neither of these problems can arise with the NPV method. If a project has non-normal cash flows, the NPV method will give the appropriate accept/reject decision.
F. Relative popularity of the various capital budgeting methods :
Despite the superiority of NPV and IRR methods for evaluating projects, surveys of corporate financial managers show that a variety of methods are used. The surveys show that the capital budgeting method used by a company varied according to four general criteria :
G. Expected relations among an investment’s NPV, company value, and share price :
In theory, a positive NPV project should cause a proportionate increase in a company’s stock price.
In reality, the impact of a project on the company’s stock price is more complicated than in theory. A company’s stock price is a function of the present value of its expected future earnings stream. As a result, changes in the stock price will result more from changes in expectations about a firm’s positive NPV projects. If a company announces a project for which managers expect a positive NPV but analysts expect a lower level of profitability from the project than the company does, the stock price may actually drop on the announcement.
If the NPV of a project is positive, the PI will be greater than one. If the NPV is negative, the PI will be less than one. It follows that the decision rule :
If PI > 1, accept the project.
If PI <1, reject the project.
E. NPV profile, comparing NPV and IRR methods when evaluating independent and mutually exclusive projects :
A project’s NPV profile is a graph that shows a project’s NPV for different discount rates, NPV = f(discount rate). The NPV of a project diminishes when the discount rate increases, which creates a decreasing curve. The project’s IRR are the discount rates where the NPV profiles intersect the x-axis, because these are the discount rates for which the NPV equals zero.
When two NPV profiles intersect, the discount rate for which NPVs are equal is called the crossover rate.
Relative advantages and disadvantages of the NPV and IRR methods :
A key advantage of NPV is that it is a direct measure of the expected increase in the value of the firm. NPV is theoretically the best method. Its main weakness is that it does not include any consideration of the size of the project.
A key advantage if IRR is that it measures profitability as a percentage, showing the return on each dollar invested. The IRR provides information on the margin of safety that the NPV odes not. From the IRR, we can tell how much below the IRR the actual project return could fall, in percentage terms, before the project becomes uneconomic (negative NPV). The disadvantages of the IRR method are the possibility of producing rankings of mutually exclusive projects different from those from NPV analysis and the possibility that a project has multiple IRRs or no IRR.
Conflicting project rankings :
Let’s consider two projects, X and Y. Project X has a higher NPV, but lower IRR than project Y. Which is the better project? Because NPV measures the expected increase in wealth from undertaking a project, NPV is the only acceptable criterion when ranking projects.
If we were to rank projects by their IRRs, we would be implicitly assuming that project cash flows could be reinvested at the project’s IRR. This is unrealistic and, strictly speaking, if the firm could earn that rate on invested funds, that rate should be the one used to discount project cash flows.
Two reasons that NPV and IRR may give conflicting project rankings are the cash flow timing and the project size.
The “Multiple IRR” and “No IRR” problems :
If a project has cash outflows during its life or at the end of its life in addition to is initial cash outflow, the project is said to have an unconventional cash flow pattern. Projects with such cash flows may have mire than one IRR.
It is also possible to have a project where there is no discount rate that results in a zero NPV, that is, the project does not have an IRR. A project with no IRR may actually be profitable.
Neither of these problems can arise with the NPV method. If a project has non-normal cash flows, the NPV method will give the appropriate accept/reject decision.
F. Relative popularity of the various capital budgeting methods :
Despite the superiority of NPV and IRR methods for evaluating projects, surveys of corporate financial managers show that a variety of methods are used. The surveys show that the capital budgeting method used by a company varied according to four general criteria :
- Location. European countries tended to use the payback period method as much or more than the IRR and NPV methods.
- Size of the company. The larger the company, the more likely it was to use discounted cash flow techniques such as the NPV and IRR methods.
- Public vs. Private. Private companies used the payback period more often than public companies. Public companies tended to prefer discounted cash flow methods.
- Management education. The higher the lever of education, the more likely the company was to use discounted cash flow techniques, such as the NPV and IRR methods.
G. Expected relations among an investment’s NPV, company value, and share price :
In theory, a positive NPV project should cause a proportionate increase in a company’s stock price.
In reality, the impact of a project on the company’s stock price is more complicated than in theory. A company’s stock price is a function of the present value of its expected future earnings stream. As a result, changes in the stock price will result more from changes in expectations about a firm’s positive NPV projects. If a company announces a project for which managers expect a positive NPV but analysts expect a lower level of profitability from the project than the company does, the stock price may actually drop on the announcement.
|
|
