28. FINANCIAL ANALYSIS TECHNIQUES
A. Tools and techniques used in financial analysis, uses and limitations :
Various tools and techniques are used to convert financial statement data into formats that facilitate analysis. These include ratio analysis, common-size analysis, graphical analysis, and regression analysis.
Ratio analysis :
Ratios are useful tools for expressing relationships among data that can be used for internal comparisons across firms. They can be used to do the following :
- Project future earnings and cash flow.
- Evaluate a firm’s flexibility.
- Assess management’s performance.
- Evaluate changes in the firm and industry over time.
- Compare the firm with industry competitors.
Analysts must also be aware of the limitations of ratios, including :
- Financial ratios are not useful when viewed in isolation. They are only informative when compared to those of other firms or to the company’s historical performance.
- Comparisons with other companies are made more difficult by different accounting treatments.
- It is difficult to find comparable industry ratios when analyzing companies that operate in multiple industries.
- Conclusions cannot be made by calculating a single ratio. All ratios must be viewed relative to one another.
- Determining the target or comparison value for a ratio is difficult, requiring some range of acceptable values.
It is important to understand that the definitions of ratios can vary widely among the analytical community.
Cross-sectional analysis is comparing a company’s ratios with those of its competitors.
Common-size Analysis :
Common-size analysis normalize balance sheets and income statements and allow the analyst to more easily compare performance across firms and for a single firm over time.
A vertical common-size balance sheet expresses all balance sheet accounts as a percentage of total assets.
A vertical common-size income statement expresses all income statement items as a percentage of sales.
A horizontal common-size balance sheet or income statement is only useful when analyzing trends over time. The divisor is the first-year values; so they are all standardized to 1.0.
Graphical analysis :
Graphs can be used to virtually present performance comparisons and composition of financial statement elements over time.
A stacked column graph (stacked bar graph) shows the changes in items from year to year in graphical form.
Another alternative is a line graph.
Regression analysis :
Regression analysis can be used to identify relationships between variables. The results are often used for forecasting. For example, an analyst might us e the relationship between GDP and sales to prepare a sales forecast.
B. Classification, calculation, and interpretation of activity, solvency, profitability, and valuation ratios :
Activity ratios :
Activity ratios measure how efficiently the firm is managing its assets.
- Receivables turnover = annual sales / average receivables
It is considered desirable to have a receivables turnover figure close to the industry norm.
- Days of sales outstanding = 365 / receivables turnover
Days of sales outstanding (average collection period) is the average number of days it takes for the company’s customers to pay their bills. It is considered desirable to have a collection period close to the industry norm. A collection period that is too high might mean that customers are too slow paying their bills, which means too much capital is tied up in assets. A collection period that is too low might indicate that the firm’s credit policy is too rigorous, which might be hampering sales.
- Inventory turnover = COGS / average inventory
A measure of a firm’s efficiency with respect to its processing and inventory management is inventory turnover.
- Days of inventory on hand = 365 / inventory turnover
It is considered desirable to have days of inventory on hand (average inventory processing period or number of days of inventory) close to the industry norms. A processing period that is too high mean that too much capital is tied up in inventory and could that the inventory is obsolete. A processing period that is too low might indicate that the firm has inadequate stock on hand, which could hurt sales.
- Payables turnover = purchases / average trade payables
- Number of days of payables = 365 / payables turnover
- Total asset turnover = revenue / average total assets
Total asset turnover measures the effectiveness of the firm’s use of its total assets to create revenue. It is desirable to have a total asset turnover close to the industry norm. Low asset turnover might mean that the company has too much assets tied up in its asset base. High asset turnover might imply that that the firm has too few assets for potential sales, or that the asset base is outdated.
- Fixed asset turnover = revenue / average net fixed assets.
As was the case with the total asset turnover ratio, it is desirable to have a fixed asset turnover ratio close to the industry norm. Since ‘net’ here refers to net of accumulated depreciation, firms with more recently acquired assets will typically have lower fixed asset turnover ratios.
- Working capital turnover = revenue / average working capital
Working capital (sometimes called net working capital) is current assets minus current liabilities. The working capital turnover ratio gives us information about the utilization of working capital in terms of dollars of sales per dollar of working capital. Some firms have very low working capital if outstanding payables equal or exceed inventory and receivables. In this case the working capital turnover ratio will be very large, may vary significantly from period to period, and is less informative about changes in the firm’s operating efficiency.
Liquidity ratios :
Liquidity ratios are employed by analysts to determine the firm’s ability to pay its short-term liabilities.
- Current ratio = current assets / current liabilities
The higher the current ratios, the more likely it is that the company will be able to pay its short-term bills. A current ratio of less than one means that the company has negative working capital and is probably facing a liquidity crisis.
- Quick ratio = (cash + marketable securities + A/R)/current liabilities
The quick ratio is a more stringent measure of liquidity because it does not include inventories and other assets that might not be very liquid. The higher the quick ratio, the more likely it is that the company will be able to pay its short-term bills. Marketable securities are short-term debt instruments, typically liquid and of good credit quality.
- Cash ratio = (cash + marketable securities) / current liabilities
The higher the cash ratio, the more likely it is that the company will be able to pay its short-term bills. The current, quick, and cash ratios differ only in the assumed liquidity of the current assets that the analyst projects will be used to pay off current liabilities.
- Defensive interval = (cash + marketable securities + receivables) / average daily expenditures
The defensive interval ratio is another measure of liquidity that indicates the number of days of average cash expenditures the firm could pay with its current liquid assets. Expenditures here include cash expenses for cost of goods, SG&A, and R&D. If these items are taken from the income statement, non-cash charges such as depreciation should be added back.
- Cash conversion cycle = days sales outstanding + days of inventory on hand – number of days of payables.
The cash conversion cycle is the length of time it takes to turn the firm’s cash investment in inventory back into cash, in the form of collections from the sales of that inventory on hand, and number of days of payables. High cash conversion cycles are considered undesirable. A conversion cycle that is too high implies that the company has an excessive amount of capital investment in the sales process.
Solvency ratios :
Solvency ratios measure a firm’s financial leverage and ability to meet its long-term obligations. Solvency ratios include various debt ratios that are based on the balance sheet and coverage ratios that are based on the income statement.
- Debt-to-equity = total debt / total equity
Increases and decreases in this ratio suggest a greater or lesser reliance on debt as a source financing.
- Debt-to-capital = total debt / (total debt + total equity)
Capital equals all short-term and long-term debt plus preferred stock and equity. Increases and decreases in this ratio suggest a greater or lesser reliance on debt as a source of financing.
- Debt-to-assets = total debt / total assets
Increases and decreases in this ratio suggest a greater or lesser reliance on debt as a source of financing.
- Financial leverage = average total assets / average total equity
Average here means the average of the values at the beginning and at the end of the period. Greater use of debt financing increases financial leverage and, typically, risk to equity holders and bondholders alike.
- Interest coverage = EBIT / interest payments
The lower this ratio, the more likely it is that the firm will have difficulty meeting its debt payments.
- Fixed charge coverage = (EBIT + lease payments) / (interest payments + lease payments)
Here, lease payments are added back to operating earnings in the numerator and also added to interest payments in the denominator. Significant lease obligations will reduce this ratio significantly compared to the interest coverage ratio. Fixed charge coverage is the more meaningful measure for companies that lease a large portion of their assets, such as some airlines.
Profitability ratios :
Profitability ratios measure the overall performance of the firm relative to revenues, assets, equity and capital.
- Net profit margin = net income / revenue
Analysts should be concerned if this ratio is too low. The net profit margin should be based on net income from continuous operations.
- Gross profit margin = gross profit / revenue
An analyst should be concerned if this ratio is too low. Gross profit (sales – COGS) can be increased by raising prices or reducing costs. However, the ability to raise prices may be limited by competition.
- Operating profit margin = EBIT / revenue
Strictly speaking, EBIT (operating income) includes some non-operating items, such as gains on investment. The analyst, as with other ratios with various formulations, must be consistent in his calculation method and know how published ratios are calculated.
- Pretax margin = EBT / revenue
- Return on assets (ROA) = net income / average total assets
ROA is one of a set of profitability ratios that measure profitability relative to funds invested in the company by common stockholders, preferred stockholders, and suppliers of debt financing. This measure is a bit misleading because interest is excluded from net income but total assets include debt as well as equity. Adding interest adjusted for tax back to net income puts the returns to both equity and debt holders in the numerator. This result is an alternative calculation for ROA :
ROA = net income + interest expense (1 – tax rate) / average total assets
- Operating return on assets = EBIT / average total assets
This measure includes both taxes and interest in the numerator.
- Return on total capital (ROTC) = EBIT / average total capital
Total capital includes short-term and long-term debt, preferred equity, and common equity. Analysts should be concerned if this ratio is too low.
- Return on equity = net income / average total equity
Analysts should be concerned if this ratio is too low. It is sometimes called return on total equity.
- Return on common equity = net income available to common shareholders/ average common equity
C. Describe the relationships among ratios and evaluate a company using ratio analysis :
An analyst should use an appropriate combination of different ratios to evaluate a company over time and relative to comparable companies. The interpretation of an increase in ROE, for example, may be quite different for a firm that has significantly increased its financial leverage compared to one hat has maintained or decreased its financial leverage.
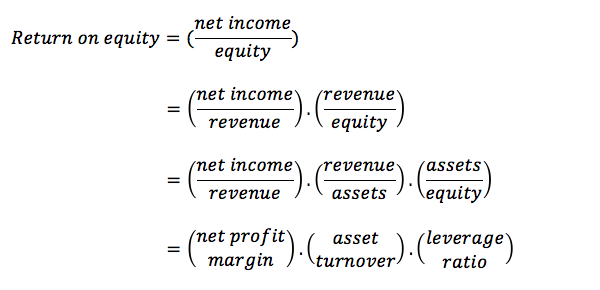
D. Application DuPont analysis of return on equity :
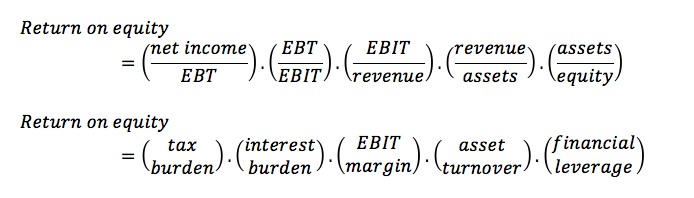
The DuPont system of analysis is an approach that can be used to analyze return on equity (ROE). It uses basic algebra to break down ROE into a function of different ratios, so an analyst can see the impact of leverage, profit margins, and turnover on shareholder returns. There are two variables of the DuPont system : The original approach and the extended five-part system.
The original approach :
Extended (5-way) DuPont equation :
E. Calculate and interpret ratios used in equity analysis, credit analysis, and segment analysis :
Equity analysis :
Valuation ratios are used in analysis for investment in common equity. The most widely used valuation ratio is the price-to-earnings (P/E) ratio, the ratio of the current market price of a share of stock divided by the company’s earnings per share. Related measures based on price per share are the price-to-cash flow, the price-to-sales, and the price-to-book value ratios.
Per-share valuation measures include earnings per share (EPS), basic and diluted. Other per-share measures include cash flow per share, EBIT per share, and EBITDA per share. Per share measures are not comparable because the number of outstanding shares differ among firms.
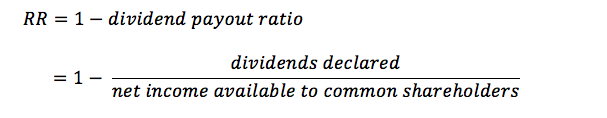
Dividends are declared on a per-common-share basis. Total dividends on a firm-wide basis are referred to as dividends declared. Neither EPS nor net income is reduced by the payment of common stock dividends. The proportion of a firm’s net income that is retained to fund growth is an important determinant of the firm’s sustainable growth rate (g).
g = Retention Rate (RR) . ROE
with :
Equity analysis :
Valuation ratios are used in analysis for investment in common equity. The most widely used valuation ratio is the price-to-earnings (P/E) ratio, the ratio of the current market price of a share of stock divided by the company’s earnings per share. Related measures based on price per share are the price-to-cash flow, the price-to-sales, and the price-to-book value ratios.
Per-share valuation measures include earnings per share (EPS), basic and diluted. Other per-share measures include cash flow per share, EBIT per share, and EBITDA per share. Per share measures are not comparable because the number of outstanding shares differ among firms.
Dividends are declared on a per-common-share basis. Total dividends on a firm-wide basis are referred to as dividends declared. Neither EPS nor net income is reduced by the payment of common stock dividends. The proportion of a firm’s net income that is retained to fund growth is an important determinant of the firm’s sustainable growth rate (g).
g = Retention Rate (RR) . ROE
with :
Credit analysis :
Credit analysis is based on many of the ratios that we have already covered. In assessing a company’s ability to service and repay its debt, analysts use interest coverage ratios, return on capital, and debt-to-assets ratios.
Segment analysis :
A business segment is a portion of a larger company that accounts for more than 10% of the company’s revenues or assets, and is distinguishable from the company’s other lines of business in terms of the risk and return characteristics of the segment. Geographic segments are also identified when they meet the size criterion above and the geographic unit has a business environment that is different from that of other segments or the remainder of the company’s business.
Both U.S. GAAP and IFRS require companies to report segment data, but the required disclosure items are only a subset of the required disclosures for the company as a whole. Nonetheless, an analyst can prepare a more detailed analysis and forecast by examining the performance of business or geographic segments separately.
F. How ratio analysis and other techniques can be used to model and forecast earnings :
Three methods of examining the variability of financial outcomes around point estimates are : sensitivity analysis, scenario analysis, and simulation.
Sensitivity analysis is based on “what if” questions such as : What will be the effect on net income if sales increase by 3% rather than the estimated 5%?
Scenario analysis is based on specific scenarios and will also yield a range of values for financial statement items.
Simulation is a technique in which profitability distributions for key variables are selected and a computer is used to generate a distribution of values for outcomes based on repeated random selection of values for the key variables.
|
|
